
You can add a table chart by doing in it to Body text field.
How to create a table chart


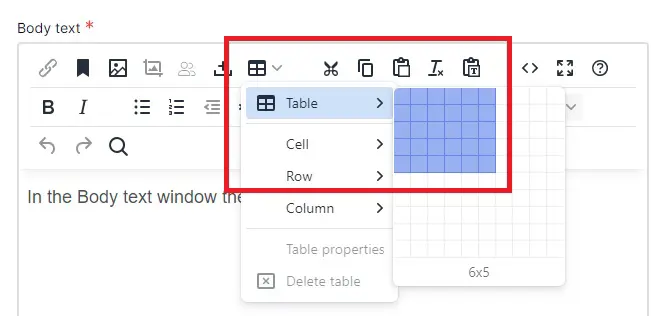
In the Body text window there is a table icon in the text editor. Press it open and on the Table row you can paint the amount of rows and columns you need for your table:
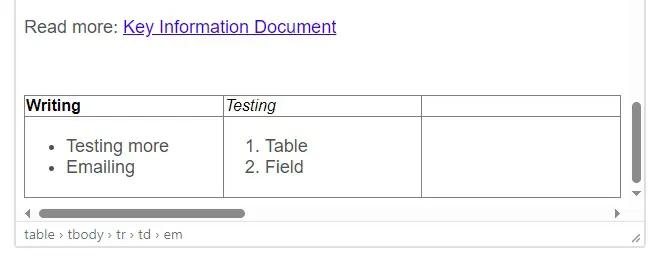
Once you've selected the size of the table, it will display on the Body text field. There you may start to fill in the text on the columns. From the other icons you can edit the rows and columns (a bit like in MS Excel):
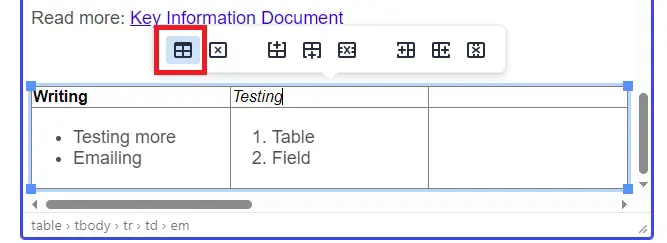
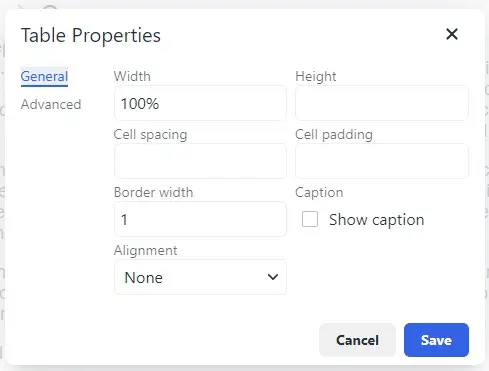
Or you can press the x icon - table properties to edit the layout and details of it:
You can also edit the text layout (image below) on the table or add images. Be aware though that the table chart is not optimized for scaling meaning that it might not always display as wanted in different devices. Remember to also preview the table before publishing it.